ScalarX monitoring is based on a decentralized approach designed for infrastructure that does not always run in a single data center, or even on a single continent.
ScalarX does not artificially centralize what should remain distributed. Our clients may have servers in several countries, with several providers, or in their own data centers. Our monitoring is designed for that reality.
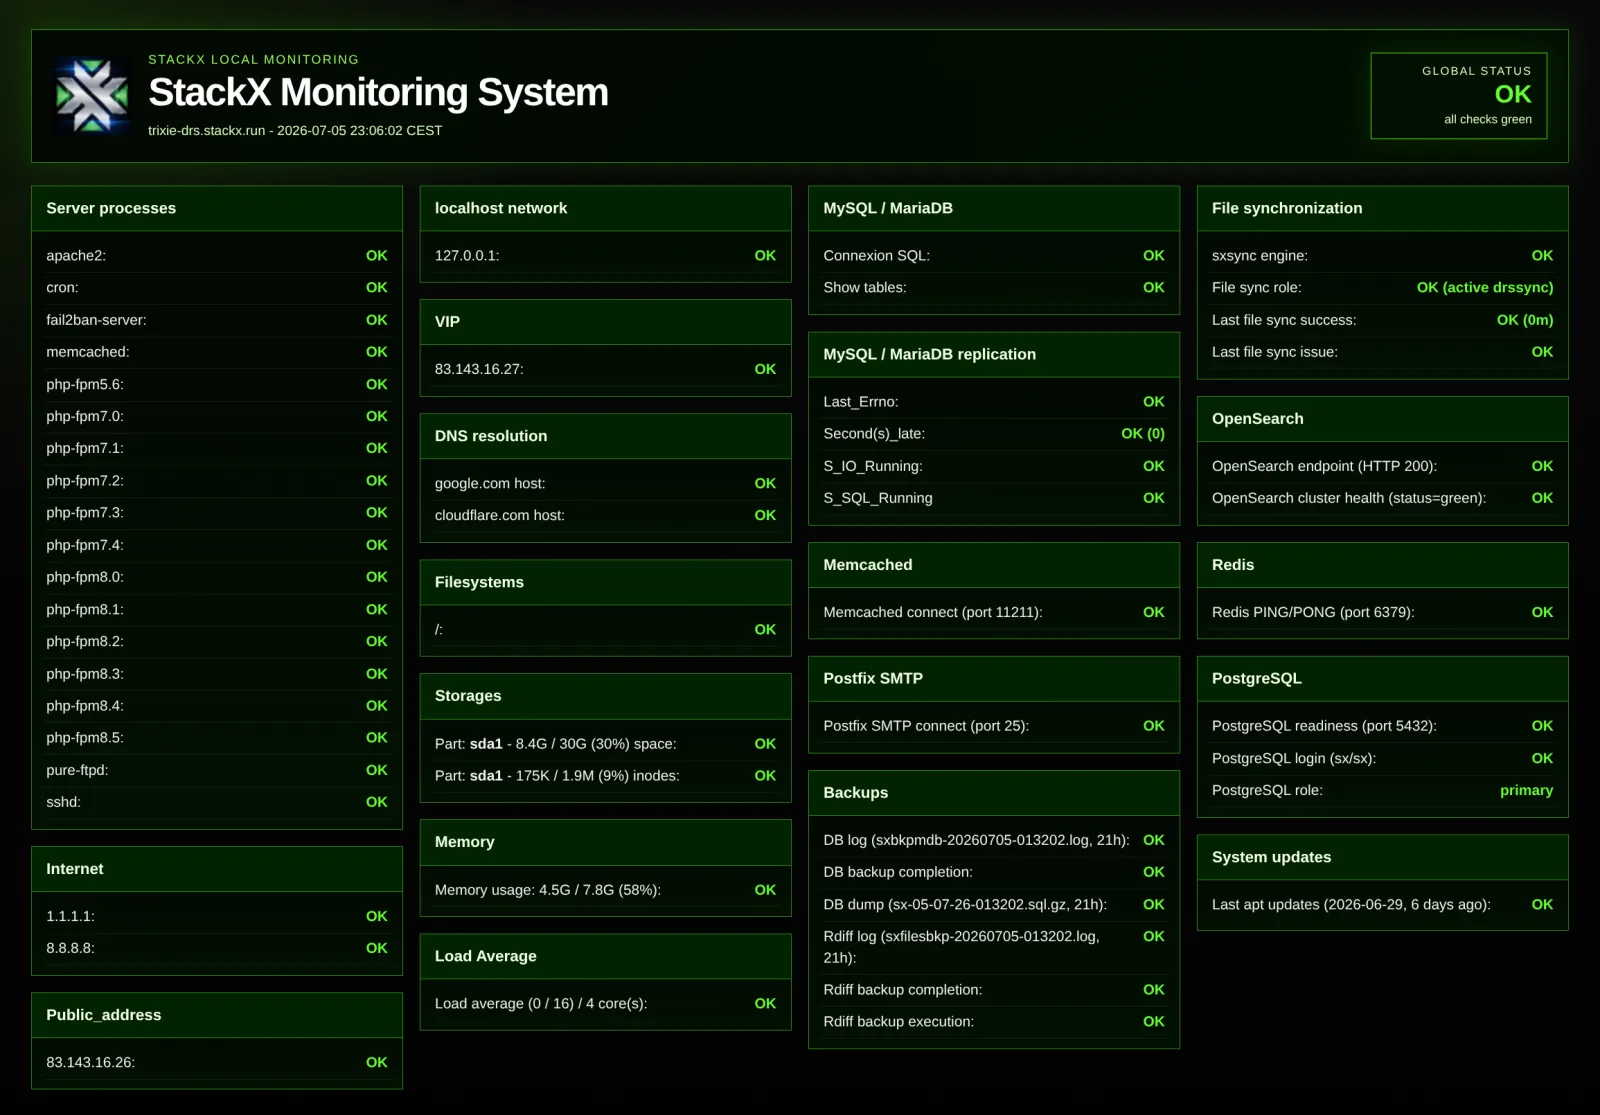
Each StackX server can dynamically generate its own local operational state, exposed through a dedicated HTTPS monitoring endpoint. Pingdom, SolarWinds, or any other system capable of checking a web page can then verify that endpoint externally.
The objective is to separate the server’s local state, service availability, the network path, and the geographic measurement point.
This model is especially useful for multi-provider, multi-country, multi-continent, or hybrid architectures, where a measurement from a single location can provide an incomplete or even misleading view of operational reality.
Decentralized Monitoring
ScalarX Monitoring Model
ScalarX Monitoring Model
Principle
Practical Application
Local server state
Each machine can produce its own operational state through StackX Monitoring System
Usable source of truth
A dedicated HTTPS endpoint returns local checks in a format an external tool can read
External check
Pingdom, SolarWinds, another tool, or a manual check can query this monitoring endpoint
Independent third party
Checks can be performed by an external provider independent of the monitored infrastructure
Geographic measurement
The measurement point can be selected according to the region, client, provider, or production scenario
Infrastructure decoupling
Monitoring does not require a ScalarX data center, a single cloud region, or a proprietary agent
Example of local StackX Monitoring System state. Each server can produce a readable local operational state that Pingdom, SolarWinds, or another monitoring tool can check externally over HTTPS.
What Monitoring Helps Distinguish
What Monitoring Helps Distinguish
Question
Operational Interpretation
Is the server healthy locally?
Expected processes, filesystems, services, and local checks reported by StackX
Is the service responding?
External validation of the exposed endpoint and associated services
Is the issue on the server?
Correlation among local state, processes, services, and reported errors
Is the issue on the network?
Comparison between a correct local state and unavailability observed from an external point
Does the issue depend on geography?
Interpretation based on country, transit, peering, CDN, provider, or BGP path
Why Centralized Monitoring Can Be Misleading
Why Centralized Monitoring Can Be Misleading
Situation
Interpretation Risk
Server in Australia, monitoring in Europe
Observed latency does not necessarily represent the actual experience of a client in the United States
Application on several continents
One measurement point cannot summarize the overall state of the service
Degraded transit or peering
The alert may come from the network path, not the server
Asymmetric route or temporary congestion
A transient error may originate in the Internet path, not the managed infrastructure
Specific CDN, provider, or region
An outage may be localized without making the service globally unavailable
StackX Monitoring ToolingSMS, Munin, alerts, and external checks
StackX Monitoring Tooling
Component
Role
StackX Monitoring System (SMS)
Generates a local server state that an external check can use
HTTPS monitoring endpoint
Dedicated address generated during deployment to return operational state without exposing the internal structure
Local check profile
Expected processes, filesystems, services, and checks based on the machine’s role
Gradual transition
The current SMS generation can temporarily coexist with a legacy check during migration
Munin
Historical metrics protected by HTTPS authentication
sxpostcheck
Post-install audit and StackX component consistency checks
sxnetstat
Operational network view of observed connections, ports, and IP addresses
sxfpmcheck
Local PHP-FPM pool checks, with JSON, full, and OpenMetrics modes
Additional StackX DiagnosticsCPU, memory, storage, and databases
Additional StackX Diagnostics
Tool
Operational Use
memcalc
Measures RAM usage by service, user, or PID
sxsqlyze
MariaDB/MySQL analysis: database/table sizes, growth, fragmentation, engines, and indexes
sxpgdb
Inventory, display, and doctor functions for PostgreSQL resources linked to environments
sxmdbsync
MariaDB/MySQL synchronization between environments, useful for recovery, testing, or PRD/DRS paths
sxbkpmdb / sxbkppgdb
MariaDB/MySQL and PostgreSQL backup with logs, retention, and execution checks
sxserialcheck
DNS serial consistency checks across name servers
What Monitoring Does Not Require
What Monitoring Does Not Require
Absent Constraint
Why It Matters
No mandatory central platform
Monitoring can be verified from several tools or external points
No required proprietary agent
A simple HTTPS check can be enough to validate the locally generated state
No single cloud region
Multi-provider or multi-continent environments remain monitorable
No fixed network topology
The model adapts to dedicated servers, public cloud, private cloud, disaster recovery, or hybrid environments
No dependency on a ScalarX data center
The server retains the ability to produce its operational state locally
Typical Local ChecksServices, network, backups, and replication
Checks volume and pool state, degradation, or errors depending on the architecture
Load average
Detects CPU pressure, saturation, or abnormal system behavior
RAM usage
Memory view by service, user, or PID through tools such as memcalc
Application services
PHP-FPM by version, databases, RabbitMQ, application components, or dedicated services
Replication / synchronization
SQL role, replication lag, file exchange state, and preparation of PRD / DRS synchronization
Network
Exposed ports, active connections, observed IP addresses, and consistency with filtering rules
Post-install consistency
Expected StackX files, configuration, monitoring, logs, permissions, and services
In practice: ScalarX can monitor a server through its local StackX state while having that state validated by an independent third party such as Pingdom or SolarWinds. The external check remains independent of the monitored infrastructure, making it easier to distinguish a server failure, service failure, network path issue, or anomaly related to the measurement point.
Use Cases
Use Cases
Context
Benefit
Isolated but critical server
Check essential components locally without imposing a heavy platform
Multi-site infrastructure
Compare local state and external availability across regions
DR / DRS
Check production and recovery nodes separately
Multi-provider
Avoid confusing a provider outage, network transit issue, and server failure
International client
Adapt measurement points to the users’ geographic reality
Need to define your monitoring scope? We can define the local checks, external measurement points, alert thresholds, and interpretation method suited to your architecture.